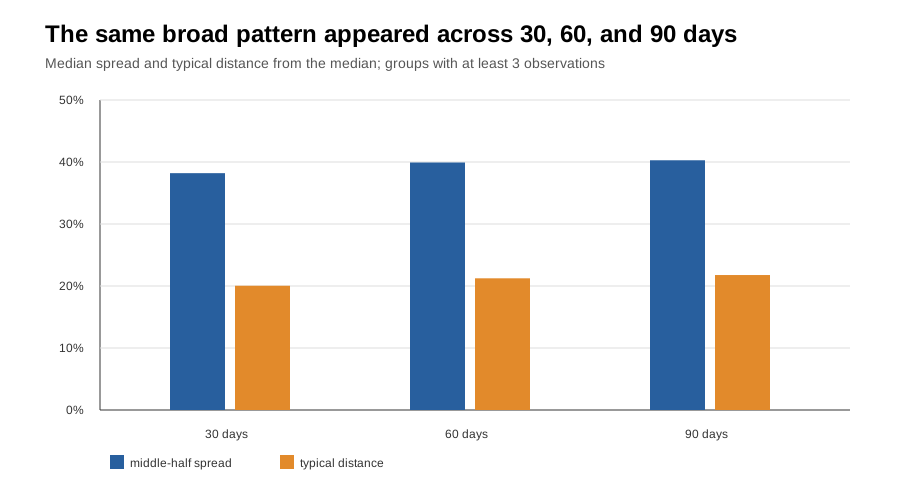
A typical observation was about 22% away
That is the typical distance between one observed sale and the median for its exact card/variant group.
What 389,602 eligible Pokémon completed-sale observations reveal about judging a card's market from a single sale.
*These are completed-sale records that passed the study's filters. We call them observations because we could not independently verify that every record represents a unique payment transaction.
It does not necessarily tell you what every copy of that exact card is selling for.
PokeSplain looked at repeated completed-sale records for the same card and variant. The result was simple: Pokémon cards often do not sell at one neat, consistent price. A single Sold Comp can be real evidence and still be an incomplete picture.
That is the typical distance between one observed sale and the median for its exact card/variant group.
More than half of eligible observations landed more than 20% above or below their group's median.
The middle half of observed prices stretched across a range equal to about 40% of the group's median.
Imagine a card with a median observed sale price of $100. Seeing one copy sell for $120 does not automatically mean the card suddenly has a $120 market price.
Likewise, seeing one copy sell for $80 does not necessarily mean the market collapsed.
Both sales are real evidence. Neither one, by itself, tells the whole story.
These numbers are a simple illustration, not a direct conversion of the study's aggregate percentages and not a claim about any specific card.
The study did not prove that any one factor caused a particular price difference. But any single listing may reflect details that matter when you compare it with another copy:
The core result was not tied to one arbitrary date range. The same broad pattern appeared in 30-, 60-, and 90-day views.
| Window | Eligible observations | Same-card groups with 3+ observations | Groups with 20+ observations |
|---|---|---|---|
| 30 days | 212,049 | 15,960 | 2,828 |
| 60 days | 337,537 | 21,134 | 6,374 |
| 90 days | 389,602 | 23,012 | 7,994 |
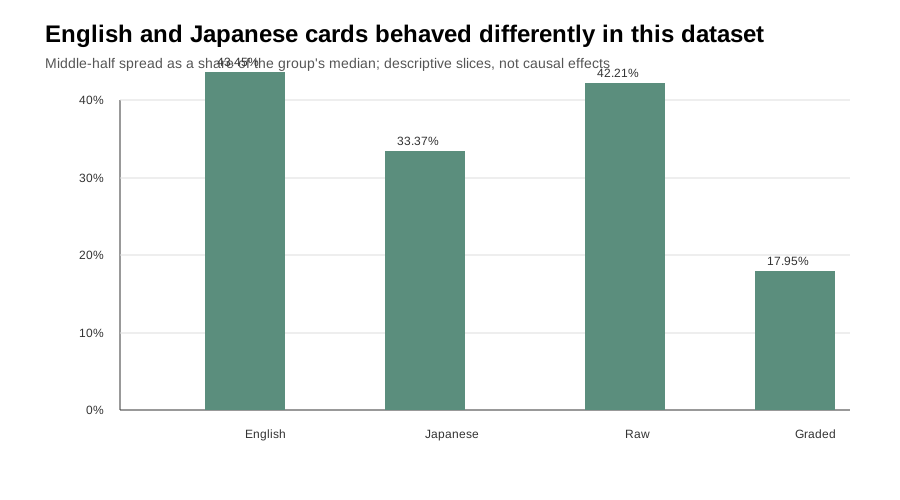
English groups had a 43.45% median middle-half spread; Japanese groups had 33.37%. Raw groups had 42.21%; graded groups had 17.95%.
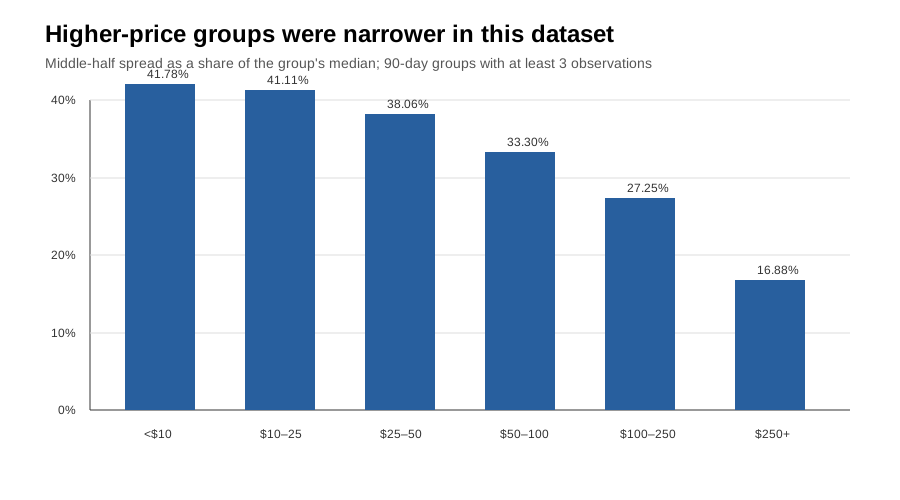
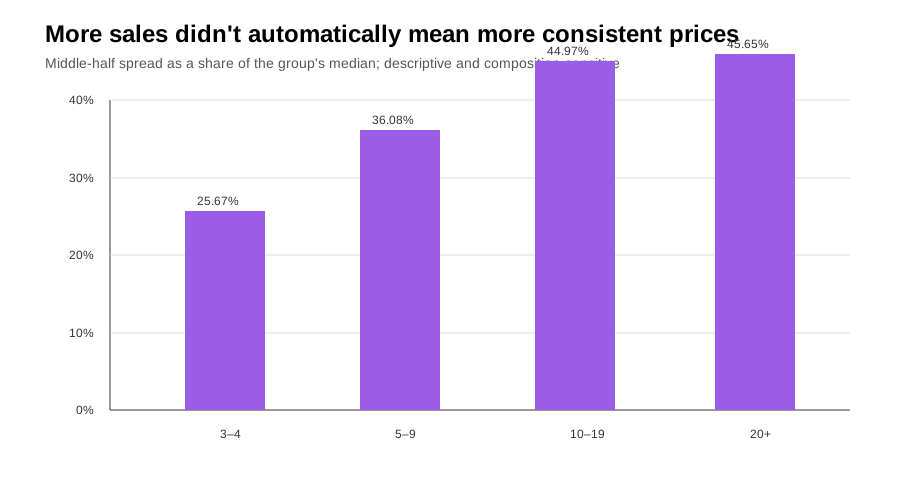
These comparisons can be shaped by card mix, price, marketplace coverage, condition, grade-company mix, and metadata quality.
These are a few high-observation examples from the study's raw English cohorts. They are illustrations, not a representative sample and not a claim about what any card is worth.
Ranges include the observed tails and should not be read as proof that every copy was perfectly comparable. Card labels were checked separately against public references; the aggregate study used production identity fields.
The main story is simple. The measurement underneath it is deliberately explicit.
The production table contained 3,407,367 raw database rows at the audit point. That is a row count, not a count of sales. The 90-day date-bounded query returned 401,804 rows before the final analysis filters. The final extract contained 389,602 eligible completed-sale listing observations.
We use “observations” because provider listing identity does not independently prove that every record is a unique payment transaction.
Records had to be completed, dated within the selected window, positive-priced, USD, pricing-quality eligible, and attached to a non-empty normalized card identity. Unmatched NO_MATCH records were excluded. English and Japanese were kept separate. Raw and graded observations were kept separate; graded groups preserved grading company and exact grade identity, and required those fields to be present. Missing condition was grouped as unknown rather than silently treated as Near Mint or another known condition.
The primary result uses 23,012 groups of the same exact card/variant with at least three observations, representing 364,773 observations. Rows were de-duplicated on provider listing identity when available, then marketplace listing identity, then database row id. No duplicates were removed from the final extract under that rule.
For each group, we calculated the median, interquartile range (the middle-half spread), median absolute deviation, coefficient of variation, high/low ratio, trimmed-mean comparison, and distance of each observation from the group median. Tukey-fence sensitivity testing checked whether outliers changed the central result. We repeated the analysis at 30, 60, and 90 days and at minimum thresholds of 3, 5, 10, and 20 observations.
PokeSplain Research uses market evidence to investigate practical questions for Pokémon collectors. We publish the methodology and limitations because a useful number is only as trustworthy as the context around it.
Explore PokeSplainPokeSplain Research. “One Sold Comp Isn't the Market.” September 20, 2026.
https://pokesplain.com/research/one-soldcomp-isnt-the-market/
Media / research inquiries: daniel@pokesplain.com
Methodology is published on this page for review and reuse.